


Feature
Rumpelstiltskin's Paradigm
How do you spin straw into gold, when you've got good data ruined by bad data?
Derek Goring and Vladimir Nikora
You know the story...
The miller bragged to the King that his daughter could spin gold from straw, but the King called his bluff. He gave the miller's daughter a roomful of straw and told her that if she did not convert it into gold there would be dire consequences. After a lot of shenanigans, Rumpelstiltskin stepped in and did the job ...
Scientists are like the miller. They brag to research funding agencies that they can produce results based on an idea, often with no appreciation of the practical difficulties they will encounter along the way. Sometimes these practical difficulties can be so profound that the job is impossible unless a Rumpelstiltskin can be found.
One example of such a difficulty is known variously as spikes, wild points, outliers, or spurious data. These can occur in any set of time-series data where you are measuring something over a period of time, such as the amount of water passing through a river mouth, traffic flow over a bridge and so on.
Something happens to produce an odd result. This can be something relatively simple, such as a breakdown in the transmission of data from the point of measurement to the datalogger.
Fixing equipment can be easy, but some problems are more difficult to deal with -- the Mars Orbiter Laser Altimeter (MOLA), for example, produced spikes in its data as it orbited Mars sending a laser beam down to the surface and measuring the time for reflection.
The idea was to get accurate measurements of the changing distance between the spacecraft and the surface, and thus produce topographical maps. But when there were dust clouds between the spacecraft and the ground, the laser beam would reflect off the particles of dust and produce an erroneously high reading.
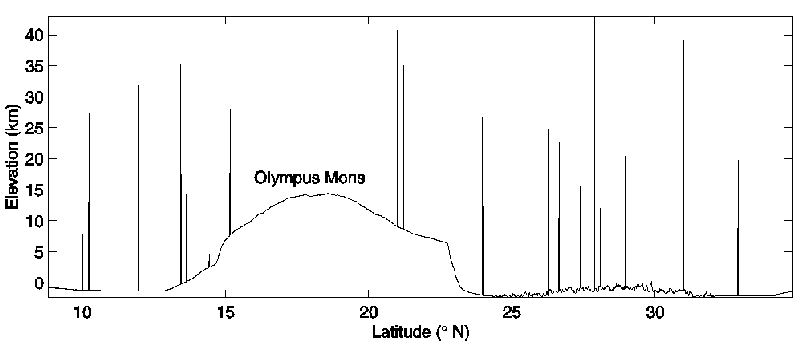
The topography in the vicinity of Olympus Mons on Mars (the highest mountain in the solar system) as recorded by MOLA and transmitted back to Earth. The spikes occur when MOLA receives reflections off clouds of dust particles.
Sometimes spikes can render a dataset useless, even though it has cost a fortune to collect. At best, the dataset may be cleaned up, but this can incur enormous labour costs. (Maybe this is what scientists are doing at work on wet Saturday afternoons in winter?)
De-spiking Data
Our team has come up with a solution to the problem of identifying bad data -- a procedure we call "de-spiking". Our method combines three independent concepts from different fields of science:
- chaos theory gives us Poincaré maps
- statistical theory gives us the Universal threshold
- signal processing theory tells us that differentiation enhances spikes
Poincaré maps reveal patterns within a signal. If the signal is completely random, the Poincaré map will be a jumble of points, but if the signal has been generated by some complicated physical process such as the weather, then it may appear random to us, but the Poincaré map can reveal hidden patterns that we cannot see otherwise.
The Universal threshold gives us a mathematical way of defining where we would expect "white-noise" data to appear in any given data set. White-noise data are completely random data, like Brownian motion of particles you get in the random bumping of molecules in a hot cup of coffee.
The Universal threshold applies to almost all environmental data, providing the data sequence is long enough. And the Universal threshold has the remarkable property that it is derived from the data itself, so calculating it can be an automated process.
Signal processing theory lets us differentiate between "real" random spikes and more meaningful data. If all spikes were like the big ones in the figure of Olympus Mons that protrude well above the mountain top, we could just set a threshold and eliminate the points that lie above it, but some spikes are more subtle than that. For example, look at the two little spikes at around 13 degrees latitude on the southern flank of Olympus Mons. Such a simple threshold would miss those.
Yet the human eye can detect spikes easily. In fact, the human eye is by far the best instrument for spike detection. Mathematics can only approximate the precision of our eyes. But one thing that signal processing tells us is that differentiation accentuates spikes and if you differentiate a second time, the spikes become even more exaggerated.
This is a clumsy attempt at doing mathematically what our eyes do intuitively.
Spot the Good Data
So we can use these three concepts to test mathematically whether we are looking at good data or bad data.
We use the Universal threshold to define an egg-shaped surface in the Poincaré map. Good data cluster inside the egg, bad data lie outside of it. Having identified the bad points, we can replace or eliminate them, thus producing a set of good data, in other words converting a dirty dataset into a clean dataset, or spinning straw into gold.
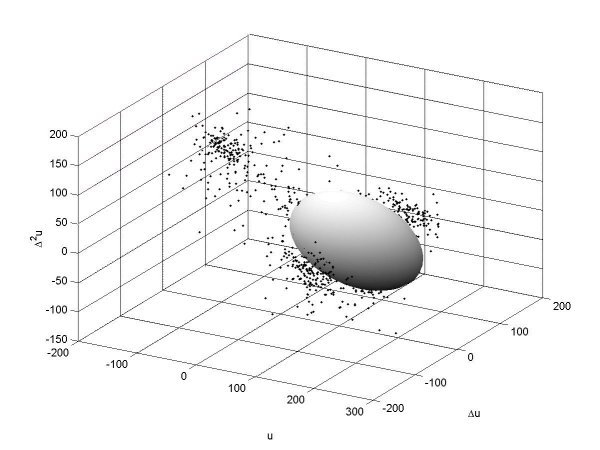
Poincaré map showing the "dirty" longitudinal velocity, u, plotted against surrogates for its first derivative, deltau, and its second derivative, delta2u, which are calculated from central differences without dividing by the time step. The quot;eggquot; is an ellipsoid with axes given by the Universal threshold, root of 2log ntheta, where theta is the standard deviation of the velocity and its derivatives. The total data sequence comprises 30,000 points and about 29,200 of these are good data that lie inside the egg. Those lying outside the egg are spikes that can be easily identified and eliminated from the record.
We have tested this out using many different sorts of environmental data (barometric pressure, wind, sea waves, etc), but we developed the method particularly for data obtained from an ADV (acoustic Doppler velocimeter) measuring water velocities near the bed of a stream.
We often observe spikes in this data, because the instrument gets confused between what it is supposed to be measuring and other things that are going on (just like MOLA does over Mars. The streambed is an area where it is very difficult to get good measurements, but it's the most important place for stream life. River-bed algae (periphyton) grow on the rocks on the stream bed, invertebrates, such as snails graze on the algae, and fish in turn feed on the invertebrates.
Previously we would have discarded the record as too spiky, and hence meaningless, but now we can clean it up and use it in our analysis. In this case, we can use the maths and the model to provide valuable information about flow properties inside aquatic canopies and between cobbles where invertebrates live.

Measurements of the longitudinal velocity near the bed of a stream showing the dirty signal (left) with many large spikes and the clean signal (right) after de-spiking. The fluctuations in the signal are turbulence. Turbulence has an important role in stream ecosystems: delivering nutrients to the bed (sweeps) and removing wastes (ejections).
Ultimately, this knowledge will enable us to determine what is good and what is bad for streams, and with this knowledge we'll be able to manage our rivers better so as to enhance ecosystems and ensure biodiversity. And the first explorers on Mars will have better maps too!
Derek Goring works at NIWA, the National Institute of Water and Atmospheric Research, in the area of eco, coastal and river hydraulics.
Vladimir Nikora works at NIWA, the National Institute of Water and Atmospheric Research, in the area of eco, coastal and river hydraulics.
All contents of this site copyright © 1990-2007 Webcentre Ltd. All Rights Reserved